Is hosting a Tesla Supercharger profitable?
The five numbers that answer it — payback, NPV, IRR, cash-on-cash, upfront capital — and the handful of inputs that actually move them.
On this page10 sections
- The five numbers that define "profitable"
- Payback — when is the money back?
- NPV — is it worth more than the alternative?
- IRR — what rate of return is this?
- Cash-on-cash — how many times over?
- Upfront capital — what does day one cost?
- The inputs that actually move those numbers
- Breakeven utilization: the most useful single lens
- Why one scenario is never enough
- What the model cannot tell you
"Is it profitable?" is the first question everyone asks about Tesla's Supercharger for Business program, and it has no general answer. The same eight stalls that model out strongly on a highway retail pad can model out deeply negative two miles away on a cheaper lease. What the question does have is a precise shape: a handful of numbers that define what "profitable" means for a charging site, and a shorter-than-expected list of inputs that decide them. This post walks through both, the way our underwriting engine computes them.
As always on this blog: this is a description of what a deterministic model calculates under stated assumptions. It is not advice, and no set of default assumptions substitutes for your own numbers.
The five numbers that define "profitable"#
A charging site is a small operating business with a large upfront build, a slow ramp, and a long life. One number can't summarize that; underwriting convention uses five, and each answers a different version of the profitability question.
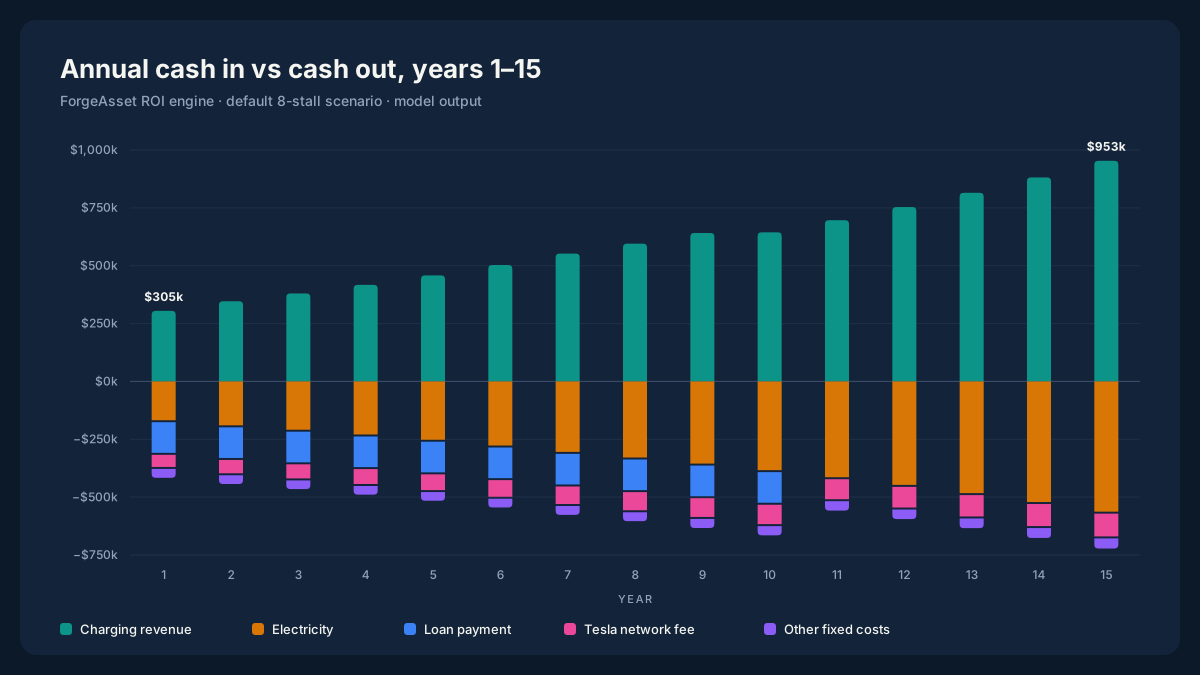
The engine's unmodified default scenario, year by year: revenue above the line, costs below it. The shape is the story — a ramp year where costs can exceed revenue, a decade of debt service that ends after year 10, and an electricity bill that scales with every dispensed kWh. The five numbers below are different summaries of this one picture.
Payback — when is the money back?#
The month cumulative operating cash crosses back above zero. A site that pays back in 38 months and one that pays back in 96 have very different risk profiles even if their 15-year totals match — the longer the payback, the longer the exposure to tariff changes, competition, and lease terms.
NPV — is it worth more than the alternative?#
Net present value restates the whole 15-year cash stream in today's dollars at a discount rate the user chooses — their required return or cost of capital. NPV above zero means the modeled stream clears that personal bar; the same site can have positive NPV at 8% and negative at 12% without a single operating assumption changing.
IRR — what rate of return is this?#
The internal rate of return implied by the same stream. Useful for comparing against other uses of the same capital, and the number most sensitive to how the early years go — because early dollars dominate a discounted stream.
Cash-on-cash — how many times over?#
Total cash collected across 15 years divided by upfront capital. The bluntest of the five, undiscounted, and the one that most rewards long holding periods.
Upfront capital — what does day one cost?#
Not total CAPEX: what leaves the bank after the loan's down payment, any grant, and the 30C tax credit's effect are counted. Two identical builds can require very different checks depending on financing and incentives — which is why the model reports this separately from construction cost.
The inputs that actually move those numbers#
The engine takes dozens of inputs, but its sensitivity analysis ranks a short list at the top over and over:
| Driver | Why it dominates |
|---|---|
| Utilization (kWh/stall/day) | Multiplies directly into every revenue dollar, every year |
| Retail price ($/kWh) | The other half of the revenue product; small moves compound over 15 years |
| Electricity cost structure | Under PG&E's BEV-2-S tariff: time-of-use energy rates plus a subscription that scales with capacity, both escalating annually |
| Site rent | The largest controllable fixed cost on leased sites, with its own escalation |
| Financing terms | Loan rate and term set a fixed annual obligation the site must clear before anything else |
Everything else — insurance, accounting, property tax, network fees — matters for precision, but the profitable-or-not question is usually decided by those five. The full cost stack is worth understanding line by line; the sensitivity concentrates here.
Breakeven utilization: the most useful single lens#
For any retail price, there is a Year-1 utilization at which the site's NPV equals zero — its breakeven utilization. Below it, the modeled site destroys value at the chosen discount rate; above it, the modeled site creates value. The engine computes this curve across a grid of prices, and the shape is always the same: at higher retail prices the breakeven bar drops substantially, because every dispensed kWh carries more margin.
This is the single most clarifying number the model produces, because it converts "is it profitable?" into a question you can actually investigate: how many kWh per stall per day is this location likely to dispense, and how does that compare to the bar? Traffic counts, nearby charger congestion, and corridor data inform the first half; the model computes the second half exactly.
Why one scenario is never enough#
A single run of any model produces false confidence. The engine addresses that three ways:
- Three scenarios. Every report computes conservative, expected, and optimistic cases under bounded input perturbations, side by side. The spread between them is information: a site whose conservative case still pays back inside the loan term is a different proposition from one whose expected case barely does.
- A sensitivity tornado. Each major input is perturbed ±20% alone to show how far 5-year cash moves — which tells you which assumptions deserve your verification effort.
- Reverse-solved thresholds. Instead of asking "what happens at my assumptions?", the engine also asks "what would each driver have to be for the site to break even?" — minimum utilization, minimum retail price, maximum electricity-cost escalation.
What the model cannot tell you#
The model computes; it does not know your site. It cannot verify that the lease you'll actually sign matches the rent input, that the utility interconnection will cost what the estimate says, that the tariff won't be revised, or whether you'll qualify for the tax treatments it values. Every report ends with a verification checklist for exactly this reason, and the methodology page cites the source and effective date of every default so you can check each one against the current version.
So: is hosting a Supercharger profitable? For a specific address, stall count, price, and set of lease and financing terms, the question resolves into five computable numbers and one breakeven bar. The scenario wizard runs that computation in a few minutes; what to make of the result is yours to judge.
All figures a scenario produces are model projections under user-supplied assumptions — not guarantees, recommendations, or advice. Actual results will differ. Verify current tariffs, incentives, and costs against the sources cited on the methodology page before relying on any number.
Model a real site
See these numbers for a specific site
The scenario wizard runs the same engine described on this blog: enter an address, stall count, price, and your assumptions, and it computes the payback, NPV, IRR, breakeven utilization, and the full 15-year cash flow for that combination.
Written by
ForgeAsset
Independent underwriting for Tesla's Supercharger for Business program. The figures on this blog come from the same filed tariffs and engine that the scenario wizard runs.
@Forge_Asset on X