Independent ROI underwriting for Tesla's Supercharger for Business program.
Every cost Tesla's configurator hides — demand charges, interconnect upgrades, ramp risk, §168(k) tax outcomes — scored, sensitivity-tested, lender-ready. Now covering forty-nine states and the District of Columbia.
The backdrop is live data: all 3,167 US Superchargersfiled tariff modelednot yet
- Total CAPEX
- $1.21M
- NPV @ 10%
- −$86,642
- IRR (15 yr)
- 8.7%
- Payback
- 171 mo
Unmodified engine defaults, shown as computed — including the negative NPV. Every input is yours to change; the math is not.
Built nights and weekends by Arun — long-time California Tesla owner and TSLA shareholder who underwrote this investment for himself first.
What Tesla's revenue projection doesn't tell you
Their configurator shows top-line kWh × retail price. The numbers below are what your CFO, lender, and CPA need before the deal pencils — and what ForgeAsset models for your specific site.
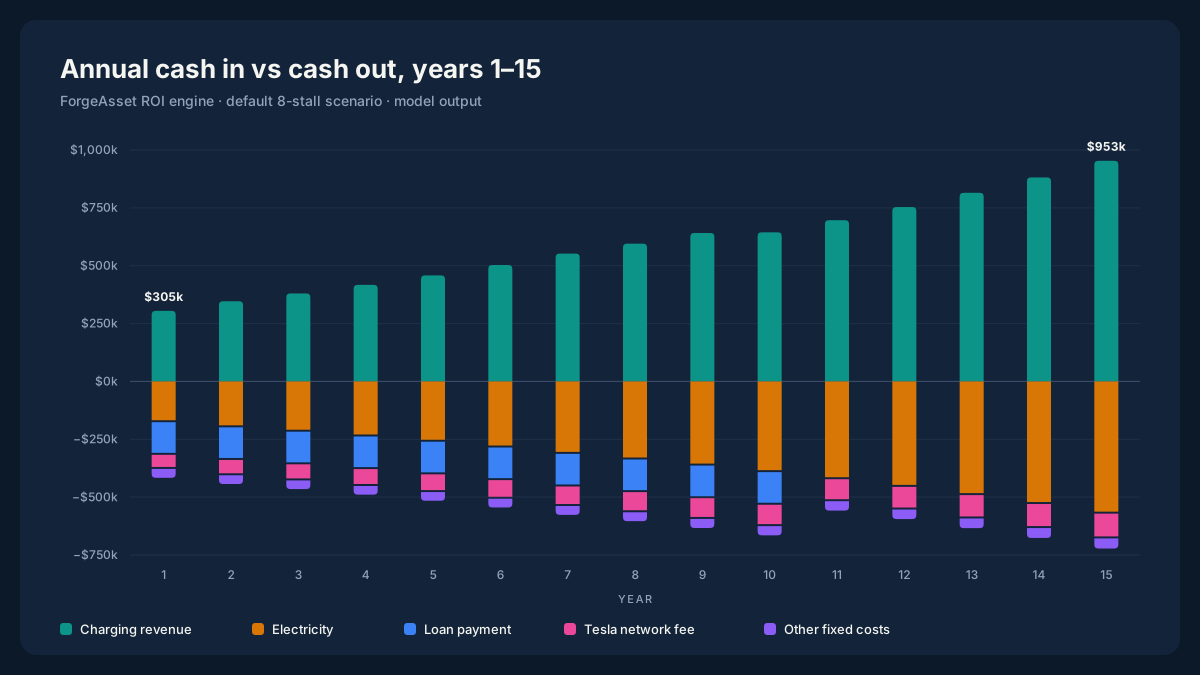
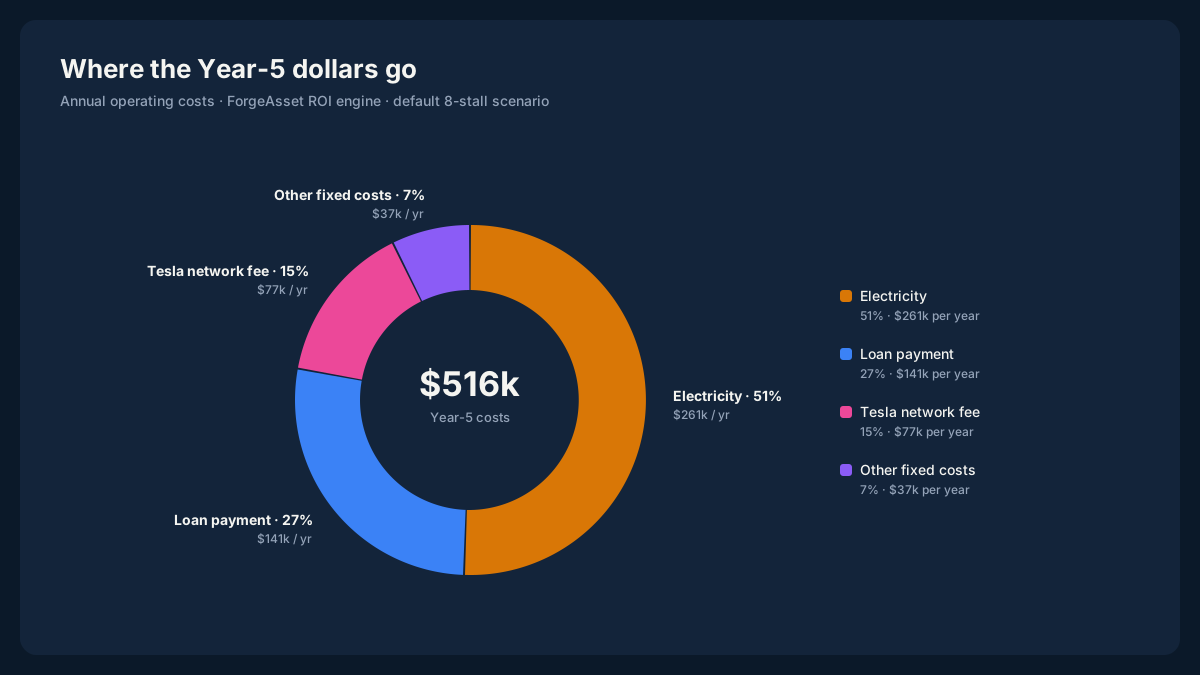
In the default scenario's first year, operating costs exceed revenue before a dollar of debt service — the bar a top-line projection never shows. Steady-state utilization changes the picture, which is why the engine models the ramp instead of assuming day-1 maturity.
Utility interconnect upgrade
$100k–$500k+ depending on transformer capacity and the utility's queue position. Tesla's quote excludes this. Without modeling it, your day-1 capex is materially understated.
Demand and subscription charges
Where a tariff carries them, demand-based components can dominate the bill at low utilization — PG&E's BEV-2-S subscription blocks, SDG&E's EV-HP demand blocks. SCE's TOU-EV-9 carries none. Tesla's number doesn't separate energy from demand.
Tesla's $0.10/kWh take
Network fee Tesla collects on every kWh dispensed. Over 10+ years on a busy 8-stall site, that's six figures of recurring cost the configurator quietly bakes into the gross.
Ramp curve (year 1 ≠ steady state)
Utilization in months 1–12 is a fraction of the eventual steady state. The model uses a site-type-aware ramp instead of assuming day-1 maturity.
Permitting + interconnect timeline
Months of zero revenue while permits and the utility interconnect move. Site-specific, modeled as a Y1 cash-flow lag rather than ignored.
Section 168(k) bonus depreciation
The full 100% bonus depreciation only applies if you materially participate under IRC §469. Passive owners typically see near-zero effective benefit — the model lets you set the rate explicitly.
LCFS credits + aggregator commission
California LCFS adds material revenue per kWh, but the aggregator takes a cut. Modeled net, not gross.
Insurance, O&M, ground maintenance
Recurring OpEx items absent from the configurator. Sized to stall count and host type, included in the annual cost stack.
Land cost or parking opportunity cost
Tesla's tool assumes you already own the parking. The model surfaces the rent or opportunity cost so the comparison is honest.
LLC franchise tax + BPP property tax
California franchise tax, gross-receipts fees, and county business personal-property tax. Small individually, material over 15 years.
Who this is for
Anyone weighing a Supercharger as an asset — from a first single stall to a tenth multi-stall site, whether you're funding it outright, financing most of it, or still deciding if it pencils at all.
Property owner
You have parking and a hosting offer in hand.
Tesla or a third party has approached you about hosting a Supercharger on your property — or you're considering applying. Decide yes/no with a real underwrite, not a sales-deck projection.
Operator / LLC
You're underwriting your 1st or Nth charging asset.
Single-asset LLC, owner-operator, possibly financed. Treating a Supercharger like a 7–11 year infrastructure deal. Need the full cash-flow build, sensitivity table, and lender-ready PDF.
Consultant / broker
You're running diligence for a client.
CRE consultant, charging-industry advisor, net-lease broker. Need an independent third-party model to defend or challenge a deal. Lever lab lets you stress every assumption.
Pitched by a developer
A charging developer handed you a proforma.
A hub developer or operator wants your site — and their projections come from the party that profits if you sign. Re-run the deal's terms through a model with no stake in the outcome, including the cost lines the pitch deck left out.
Financed buyer
You have the down payment, not the full capex.
A multi-stall build is a seven-figure project, but the check you write is the equity. Set down payment, rate, and term, and see the payback, NPV, and cash-on-cash that fall out of the structure you can actually fund.
Still shopping for a site
You have capital and a map, not an address.
Utility territory sets the demand charges, and demand charges move the deal more than hardware does. Compare candidate locations across the tariff library before committing to one.
Retail or hospitality owner
Nobody has approached you — you're asking first.
C-store, hotel, shopping center, restaurant pad. The parking already exists; the open question is whether the asset pencils on your land at your utility's rates, before going looking for a host agreement.
Lender / credit
Someone is asking you to finance one.
Borrower proformas arrive optimistic. Rebuild the cash flows from the tariff up, stress utilization, and read the coverage under assumptions you set rather than the ones in the deck.
Enter your site.
Address, stalls, host type. We resolve county, utility, and nearby supercharger distance.
See your numbers.
Payback in months, NPV at your discount rate, 15-year IRR, and cash-on-cash multiple. Plus what must be true for the deal to pencil.
Buy the report.
$149 buys the full PDF + interactive web report. All locked sections unlock; AI Analyst included for that site.
What does one month of charging look like?
Three inputs, simple arithmetic, real filed rates. The spread between territories is the reason site-level underwriting exists.
One month at these inputs · 8 stalls
$25,733 gross charging revenue / month
- Tesla per-kWh fee
- −$5,718 / month
- Electricity, by territory
- −$2,680 to −$60,075 / month
- Left over, before everything else
- $-40,061 to $17,334 / month
Against an indicative $1,210,000 for hardware and install, that margin recovers the outlay in 5.8 years in the cheapest covered territory — and never, at these inputs, in the most expensive one.
Arithmetic only: one steady month, the engine default time-of-use mix, a 12% energy loss gross-up, and the filed rates of 96 tariffs. It leaves out rent, insurance, taxes, financing, the utilization ramp, rate escalation, LCFS credits, and incentives — the full engine models all of them over 15 years for a specific address.
What's inside the report
Every report contains these sections, computed from your inputs. Run your site to see your own numbers.
Section 1
Cover page
Site, date, prepared-for.
Section 2
Executive Summary
The headline metrics — payback, NPV, IRR, cash-on-cash, upfront capital — framed as model output, not a recommendation.
Section 3
What Must Be True
The three threshold conditions the result depends on.
Section 4
Site & Assumption Snapshot
Every input you entered, sourced.
Section 5
Revenue Build
Utilization ramp, $/kWh, LCFS, Y1–Y15 revenue.
Section 6
Cost Stack
Electricity (energy + demand), Tesla network fee, fixed ops, taxes.
Section 7
Cash Flow Model
Year 1 by month, then Y1–Y15 by year.
Section 8
Sensitivity Analysis
Tornado of the top drivers plus the supporting matrices.
Section 9
Scenario Comparison
Conservative / Expected / Optimistic side by side.
Section 10
Required-To-Succeed
The minimum retail price, utilization, LCFS, and max escalations.
Section 11
Risk Register
The modeled risks, ranked by severity × probability.
Section 12
What To Verify
A neutral checklist of facts to confirm against the real world.
Section 13
Appendix
Methodology, formula references, and the full disclaimer.
Pricing
$149 buys an independent underwriting report — versus $5k–$15k for a CRE diligence engagement or a consultant's model. Operator-grade deal-modeling software lists at $1,499 one-time to $4,999/mo per seat. On a $0.6M–$5.4M capex decision, the cost of the report is rounding error.
Free
$0
Run the numbers.
- Unlimited scenarios
- Scenario outcome + dashboard
- No report download
Per Report
$149one-time
Underwrite one site.
- Full PDF + interactive report
- Lever lab — 3 model variants
- AI Analyst for this scenario
Pro
Annual save 17%$99/mo · $990/yr
Underwrite a portfolio.
- Monthly: 1 credit / mo
- Annual: 4 credits day 1 (3 signup bonus + 1) · then 1 / mo
- 25 model variants on annual (vs. 3)
- Watchlist · cross-scenario AI Analyst
Multi-site or broker volume? Pack of 5 ($499) or Pack of 10 ($999) — no subscription, 90- and 180-day windows.
Model your site in ~8 minutes. A free account shows your results; the $149 underwriting report is an optional unlock, only if the result is one you want to act on.
Covered today: forty-nine states and the District of Columbia, eighty-five filed tariffs
ForgeAsset models eighty-five filed tariffs across forty-nine states and the District of Columbia — California (PG&E, SCE, SDG&E), Georgia, North Carolina, Florida, Arizona, Texas, Virginia, Illinois, Michigan, Tennessee, Oregon, Pennsylvania, Montana, Idaho, Kansas, Nebraska, North Dakota, South Dakota, Wyoming, New Mexico, Oklahoma, Alabama, Missouri, Wisconsin, Iowa, Indiana, Louisiana, Nevada, Washington, Ohio, Utah, New Hampshire, Kentucky, South Carolina, Massachusetts, Minnesota, New Jersey, Colorado, Maryland, Arkansas, Mississippi, West Virginia, Alaska, Hawaii, Maine, Delaware, Washington, DC, and Vermont — each rate digit-verified against the utility's own filed sheets, plus per-state tax profiles (entity costs, sales tax, business personal property, clean-fuels credit lines). Built one state at a time, rigorously, rather than waving hands at fifty utilities. Outside these territories, results will not be accurate — the tool states that up front rather than shipping a generic number.
In-depth state guides: Alabama, Alaska, Arizona, Arkansas, California, Colorado, Delaware, Florida, Georgia, Hawaii, Idaho, Illinois, Indiana, Iowa, Kansas, Kentucky, Louisiana, Maine, Maryland, Massachusetts, Michigan, Minnesota, Mississippi, Missouri, Montana, Nebraska, Nevada, New Hampshire, New Jersey, New Mexico, New York, North Carolina, North Dakota, Ohio, Oklahoma, Oregon, Pennsylvania, Rhode Island, South Carolina, South Dakota, Tennessee, Texas, Utah, Vermont, Virginia, Washington, Washington, DC, West Virginia, Wisconsin, and Wyoming.
The filed demand-charge and time-of-use structure for every covered tariff is browsable in the free demand-charge lookup — no account needed.
Need a different territory? Email the waitlist with your utility and state — that signal drives which state ships next.
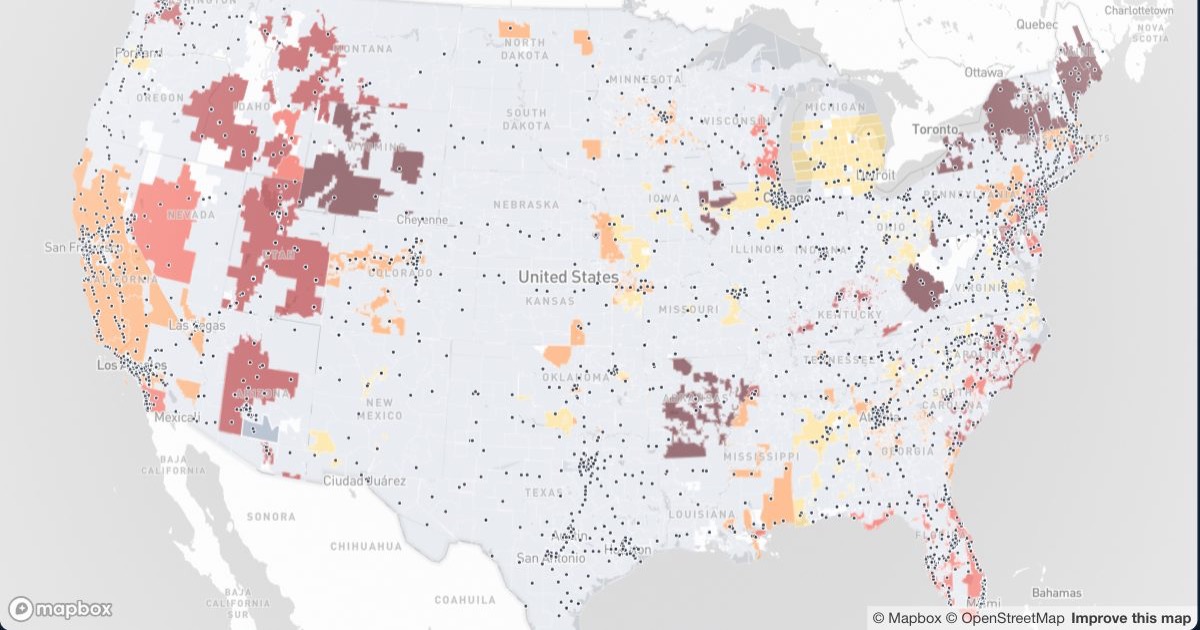
US Supercharger Economics Map
Every US Supercharger over a utility-territory map colored by the derived effective electricity cost per dispensed kWh — 95 priced territories across 50 states, computed from the same filed tariffs the model runs on.
FAQ
›Why $149 for a report?
Because the decision you're making is $0.6M–$5.4M in capex, depending on stall count. The report is under 0.03% of project cost.
›Can I get a refund?
If billing goes wrong, we refund it: a duplicate or mistaken charge, a charge where no report was actually delivered, or a credit pack you haven't touched within 30 days of buying it. Email [email protected] with the receipt or scenario ID and we'll sort it out. What we can't take back is a delivered report — it's a digital product, delivered the moment it's generated. Every number in it is a projection from assumptions printed on the report itself; the method is published on the methodology page, and the wizard lets you change any input you disagree with and re-run it. Pro subscriptions cancel at any time — you keep access through the end of the period you've paid for, and no further charges occur. Full terms are on the Terms of Service page.
›What happens if I switch between monthly and annual?
You never lose time you've paid for. Switching monthly to annual takes effect immediately — the annual charge is reduced by credit for the unused part of your monthly period. Switching annual to monthly is scheduled: you keep full annual access until the end of the year you paid for, and monthly billing starts only after that. A scheduled switch can be cancelled any time before it takes effect by re-selecting your current plan on the account page. Cancelling outright works the same way — access runs to the end of the period you've paid for.
›What's your data source for tariffs?
Official filings, digit-verified against each utility's own filed sheets. Eighty-two tariffs across forty-nine states and the District of Columbia are covered today: California (PG&E, SCE, SDG&E), Georgia, North Carolina, Florida, Arizona, Texas, Virginia, Illinois, Michigan, Tennessee, Oregon, Pennsylvania, Montana, Idaho, Kansas, Nebraska, North Dakota, South Dakota, Wyoming, New Mexico, Oklahoma, Alabama, Missouri, Wisconsin, Iowa, Indiana, Louisiana, Nevada, Washington, Ohio, Utah, New Hampshire, Kentucky, South Carolina, Massachusetts, Minnesota, New Jersey, Colorado, Maryland, Arkansas, Mississippi, West Virginia, Alaska, Hawaii, Maine, Delaware, Washington, DC, Vermont, Rhode Island, and New York. Rates are re-checked within 2 weeks of any revision.
›Are you affiliated with Tesla?
No. We are not paid by Tesla, EPCs, aggregators, or hardware vendors. We charge users directly so we can stay unbiased. We use the Tesla name only to describe what we model.
›Is this tax / legal / investment advice?
No. ForgeAsset is software. The author is a software engineer, not a licensed financial adviser, CPA, or attorney. We provide a financial model from inputs you supply; you make the decisions. Always consult a licensed CPA and attorney before committing capital.
Methodology · Privacy · Terms · About · Contact
Built nights and weekends by Arun — long-time California Tesla owner and TSLA shareholder. Independent scenario-modeling tool. Not a financial firm. Not affiliated with Tesla. ForgeAsset operates no chargers, sells no installations, and has no stake in any transaction modeled here.