What it costs to host a Tesla Supercharger
Every cost line the underwriting engine models for a Supercharger for Business site: hardware, install, utility upgrades, electricity under 85 filed tariffs, rent, taxes, and hidden fees.
On this page6 sections
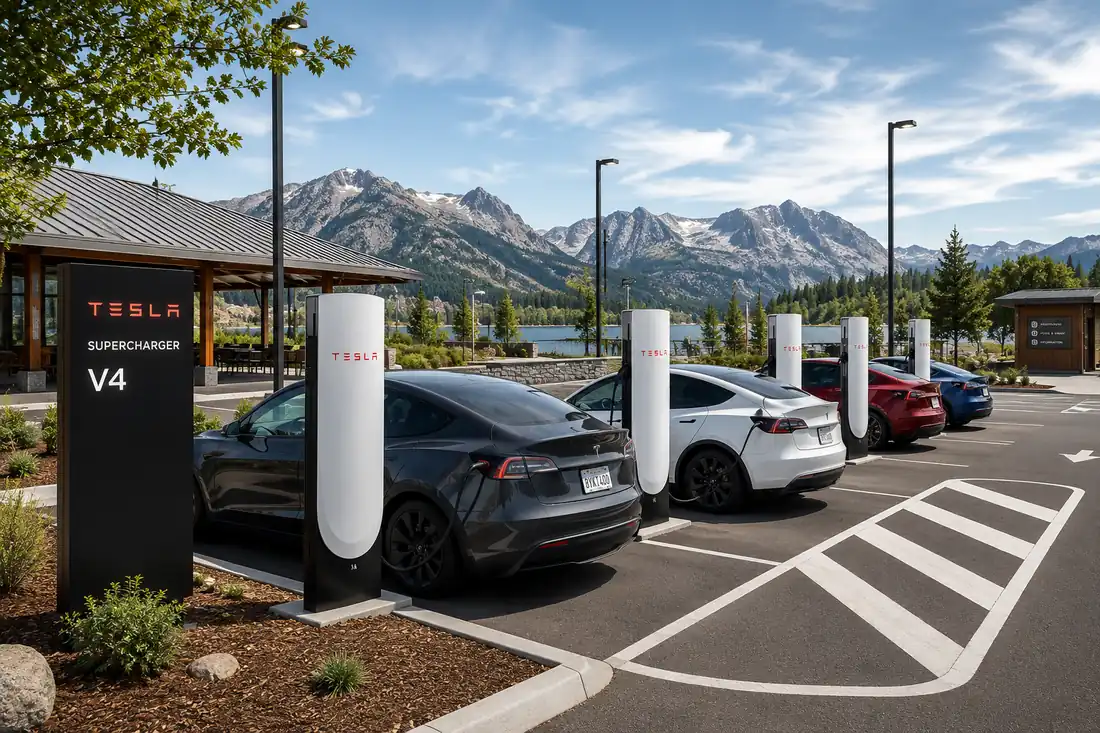
Most public discussion of Tesla's Supercharger for Business program focuses on two numbers: what the hardware costs and what drivers pay per kWh. A site's economics are decided by a much longer list. This post walks through every cost line the ForgeAsset underwriting engine models, in the order they hit the cash flow statement. Nothing here is advice — it is a description of what the model computes and where each line comes from.
(Updated 2026-07-21: the electricity section below originally described one California tariff. The library behind the engine now carries 85 filed tariffs across 49 states and DC, so this version describes the full range of rate structures the model expresses — and how much the answer moves between territories.)
Upfront: the CAPEX stack#
Four lines make up total CAPEX in the model:
- Hardware per stall. The dispenser and its share of the power cabinet.
- Install per stall. Trenching, conduit, concrete, switchgear, and labor. On many sites install rivals or exceeds the hardware line.
- Utility upgrade. What the utility charges to bring sufficient capacity to the property — a transformer, service drop, or line extension. This line varies from roughly zero to six figures depending on what is already at the site, which is why the model treats it as its own input rather than folding it into install.
- Contingency. A percentage applied to the subtotal above, because construction estimates move between bid and completion.
A one-time sales tax on the hardware purchase lands in month 1 of the cash flow, and if the project is financed, the loan's down payment — not total CAPEX — is what leaves the bank on day one.
Every month: electricity — the line that varies most by territory#
Electricity is the largest operating cost for most modeled sites, and its structure matters as much as its rate. A DC fast-charging site's bill has two parts — energy (per kWh, usually on time-of-use rates that are cheaper overnight and most expensive in the late-afternoon peak) and a capacity or demand component — and utilities file that second part in structurally different ways. The engine expresses four of them:
- Subscription blocks. PG&E's BEV-2-S replaces traditional demand charges with blocks of kW capacity priced per block per month, scaled to stall count × kW per stall. SDG&E's EV-HP works the same way in 25 kW blocks.
- Per-kW demand charges. The classic structure: a filed $/kW rate applied to the month's peak draw. Across the library this rate runs from a few dollars to $37.95/kW per month (Versant Power's Bangor Hydro M-2, the heaviest in the library) — and because a Supercharger's peak is high relative to its energy volume, this line can exceed the energy line.
- EV-specific relief structures. Some utilities file rates designed for charging loads: Massachusetts' EV rates tier the demand charge by annual load factor, and FPL's GSLD-1EV caps billed kW at kWh purchased ÷ 75 — a limiter that cuts the demand line sharply at low utilization.
- Market-priced supply. In Rhode Island, upstate New York, and Maine, sites of this size buy supply at prices that change monthly with the market. The model folds a trailing twelve-month average of the filed monthly prices and discloses that the figure is an estimate, not a filed rate.
Two further details in the model surprise people:
- The energy loss factor. The utility meter reads more kWh than vehicles receive; conversion and cabling losses sit between them. The model bills the site for metered kWh but earns revenue only on dispensed kWh.
- Escalation. Energy and capacity costs escalate annually in the model — a compounding line that a flat-rate estimate misses entirely.
The same site, priced in 81 territories#
Because those structures differ so much, the single most consequential input in the whole model is which utility serves the parcel. Run one fixed reference site — the model's default scenario, with a 30/45/25 time-of-use energy mix, 150 kW per stall, and 12% charging losses — through every tariff in the library, and the effective electricity cost per dispensed kWh spans roughly $0.15 to over $1.10, with a median around $0.38. In the most demand-heavy territories the model's effective cost exceeds its default retail price: at default assumptions, the site pays more for power than it sells it for, before any fixed cost.
That spread is now browsable: the Supercharger economics map colors every covered utility territory by that derived effective cost, with all 3,167 US Superchargers overlaid, and the utility rankings list the same library as a table. Both derive from the same filed-tariff library the wizard uses.
Every month: the fixed stack#
These lines run whether the site dispenses one kWh or ten thousand:
| Line | What the model uses |
|---|---|
| Site rent | $/stall/month with annual escalation (leased sites) |
| Loan payment | Amortized principal + interest over the loan term |
| Insurance | Annual premium |
| BPP property tax | County tax on the equipment's depreciated value |
| LLC franchise + gross-receipts fees | State minimums and revenue-scaled fees |
| Accounting | Annual cost, prorated monthly |
| Employer FICA | Payroll tax on any staffed labor |
The Tesla network fee — a per-kWh charge for operating on the Supercharger network — is variable rather than fixed, and the model applies it to every dispensed kWh.
The tax lines are state-shaped, not generic. Several states levy a tax on the charging transaction itself — a per-kWh excise in states including Georgia, Kentucky, Iowa, and Wisconsin, and a percentage tax on charging revenue in Utah — on top of the entity-level differences (franchise taxes, gross-receipts fees, BPP treatment) that the model carries per state. Each state's page (for example, Georgia) lists what the model applies in that state and cites the statute.
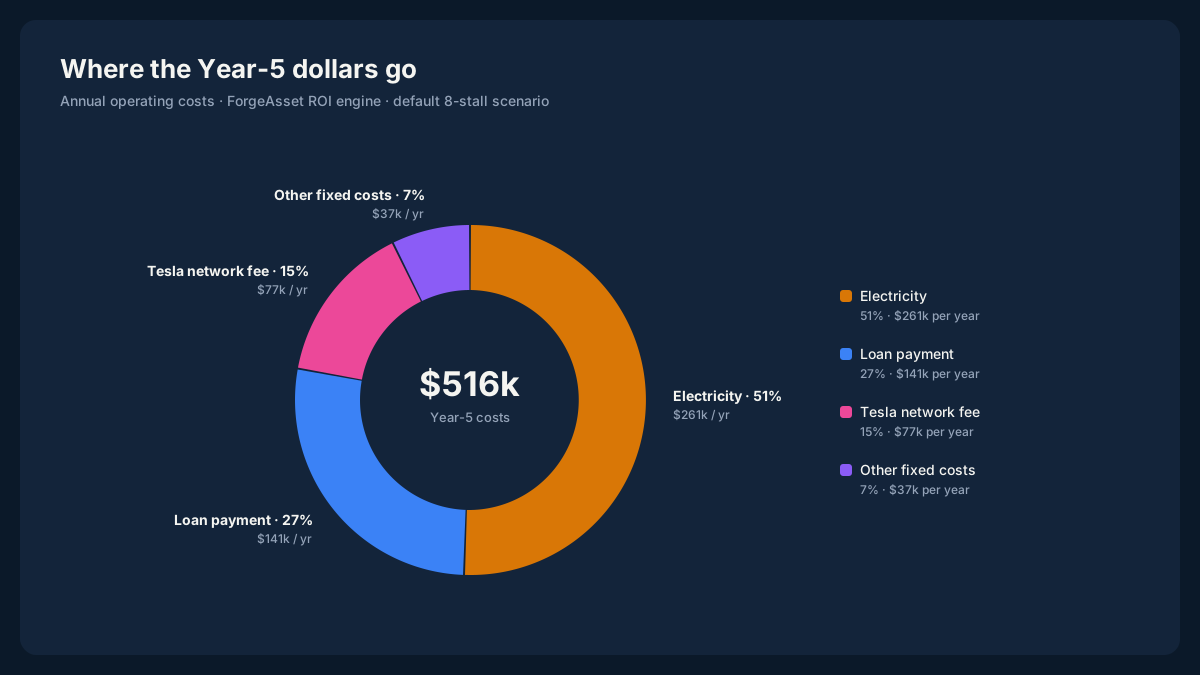
How the lines above combine in practice: the default scenario's year-5 operating costs, as the engine computes them. Electricity is half the annual spend; the loan and the Tesla network fee together are another four-tenths; everything else — rent, insurance, taxes, accounting — fits in the remainder.
What offsets the costs#
The cost stack is one half of the ledger. The model also computes the offsets, each with its own timing:
- The federal 30C ITC, a one-time credit against the project's tax basis, subject to eligibility and a statutory sunset date.
- Depreciation, valued as tax-shield cash inflows at the owner's marginal rate — with usability that depends on the IRS §469 material-participation tests, which is why every report carries a note on that subject.
- LCFS credits (California), earned per dispensed kWh for the program's crediting window, net of an aggregator's commission.
- Grants, where a program applies, modeled with their actual disbursement month rather than as day-one cash.
State and utility programs vary as much as the tariffs do; the incentives checker lists what is recorded for each of 47 jurisdictions, with unverified items flagged as such.
Why the full list matters#
A site that looks profitable on a hardware-plus-electricity estimate can model out negative once the subscription blocks, rent escalation, BPP tax, and the network fee are on the ledger — and a site that looks marginal can model out positive once the ITC and LCFS timing are in. The engine's job is to put all of these lines on one 15-year statement so the result reflects the whole stack, not the two most visible numbers.
The methodology page lists every data source, with citations and effective dates. To see the full stack computed for a specific address, stall count, and set of assumptions, the scenario wizard runs the same engine described here.
All figures a scenario produces are model projections under user-supplied assumptions, not guarantees or advice. Tariffs, incentives, and costs change; verify current values against the cited sources before relying on any number.
Model a real site
See these numbers for a specific site
The scenario wizard runs the same engine described on this blog: enter an address, stall count, price, and your assumptions, and it computes the payback, NPV, IRR, breakeven utilization, and the full 15-year cash flow for that combination.
Written by
ForgeAsset
Independent underwriting for Tesla's Supercharger for Business program. The figures on this blog come from the same filed tariffs and engine that the scenario wizard runs.
@Forge_Asset on X