Demand charges, explained for Supercharger hosts
Electricity has two prices: one for how much you use, one for your single highest 15-minute spike. For DC fast charging the second one decides the outcome — and it varies 10× by utility.
On this page6 sections
A single Tesla Supercharger stall can pull 250kW. That power spike — not the electricity itself — is usually what decides whether hosting one earns money or quietly loses it. The line item behind it is the demand charge, and it is the one most site owners never read.
Tesla's Supercharger for Business program lets a property owner host stalls and keep the charging revenue. The network's economics get debated constantly; the math for a single site rarely does. This post walks through the cost line that moves that math the most. Nothing here is advice — it is a description of what filed tariffs say and how the model prices them.
Electricity has two prices#
Commercial electricity bills split into two fundamentally different charges:
- Energy (kWh) — how much electricity was consumed over the month.
- Demand (kW) — the single highest sustained draw, typically measured in 15-minute intervals, at any point in the month.
For most businesses the second one is an afterthought. An office building's draw is broad and flat, so its peak sits close to its average and the demand line stays small relative to energy.
DC fast charging inverts that. A site can sit idle for hours, then have a few vehicles arrive at once and pull hundreds of kW for twenty minutes. That single interval sets the demand charge for the entire month — the other 43,000 minutes do not lower it. A site with low utilization and one busy afternoon pays the same demand charge as a site that hit the same peak every day.
The same peak, priced six ways#
How large the resulting bill gets depends almost entirely on which utility the property happens to sit under. Six examples from ForgeAsset's covered jurisdictions, every rate taken from the utility's own filed sheets:
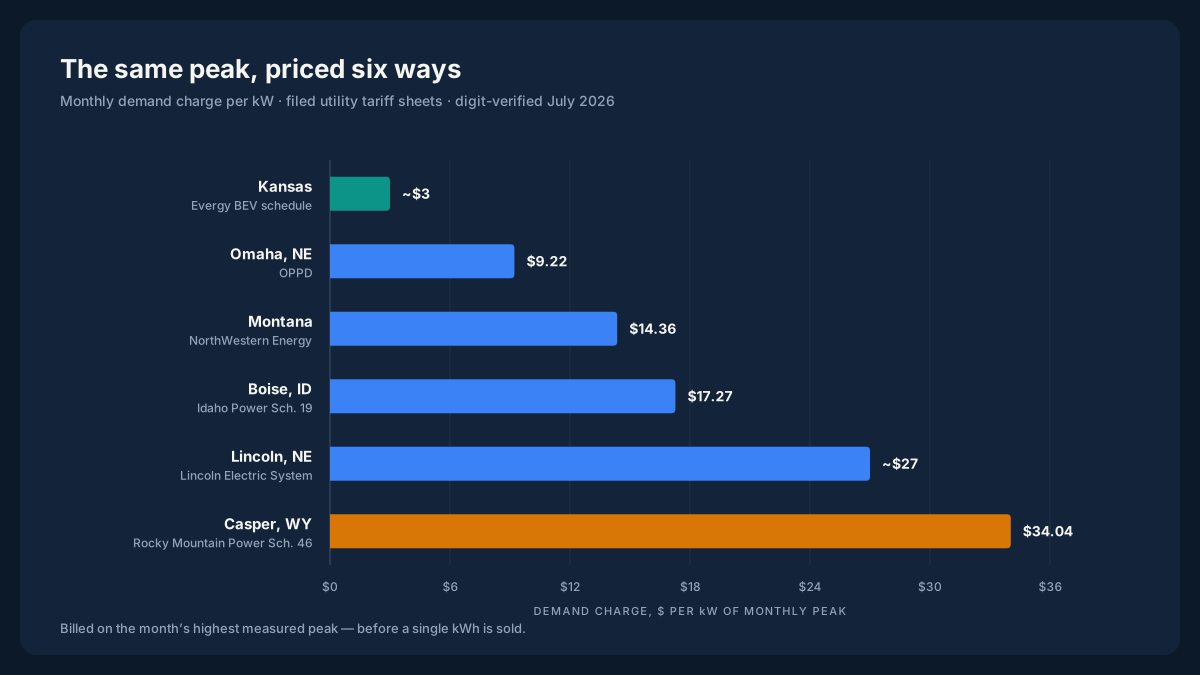
The same measured peak, billed six different ways. Kansas sits at roughly a tenth of Casper — a spread set by rate design, not by anything happening at the site.
| Jurisdiction | Utility / schedule | Demand charge |
|---|---|---|
| Kansas | Evergy, Business EV Charging Service | ~$3 per kW |
| Omaha, NE | Omaha Public Power District | ~$9.22 per kW |
| Montana | NorthWestern Energy | ~$14.36 per kW |
| Boise, ID | Idaho Power Schedule 19 | ~$17.27 per kW |
| Lincoln, NE | Lincoln Electric System | ~$27 per kW |
| Casper, WY | Rocky Mountain Power Schedule 46 | ~$34.04 per kW |
The seven-state rate designs behind several of these — including the stacked components that resolve to a single per-kW figure in Idaho and Wyoming — are compared in detail in Demand charges across the Plains and Mountain West.
What the spread costs in dollars#
Rates per kW are abstract until they meet a site's peak. Take a site that draws 500kW at its monthly maximum:
- At Casper's ~$34.04 per kW, the demand line runs roughly $17,000 per month — before the site sells a single kWh.
- At Kansas's ~$3 per kW, the same 500kW peak costs roughly $1,500 per month.
Same hardware, same vehicles, same sessions. The difference is which side of a utility border the pad sits on. This is the mechanism behind a pattern the engine produces repeatedly: a station that models as healthy in one service territory and deeply negative in the one next door, with no operating assumption changed.
Structurally, the demand charge is a bet on utilization. It is a fixed monthly cost derived from peak power, spread across however many kWh the site dispenses. High utilization dilutes it across more revenue; the ramp years, when volumes are lowest, are when it weighs most.
Demand sits inside the biggest line of all#
The demand charge is one component of electricity, and electricity is the largest operating cost in most modeled sites. In the engine's unmodified default 8-stall scenario, year-5 operating costs total $516k:
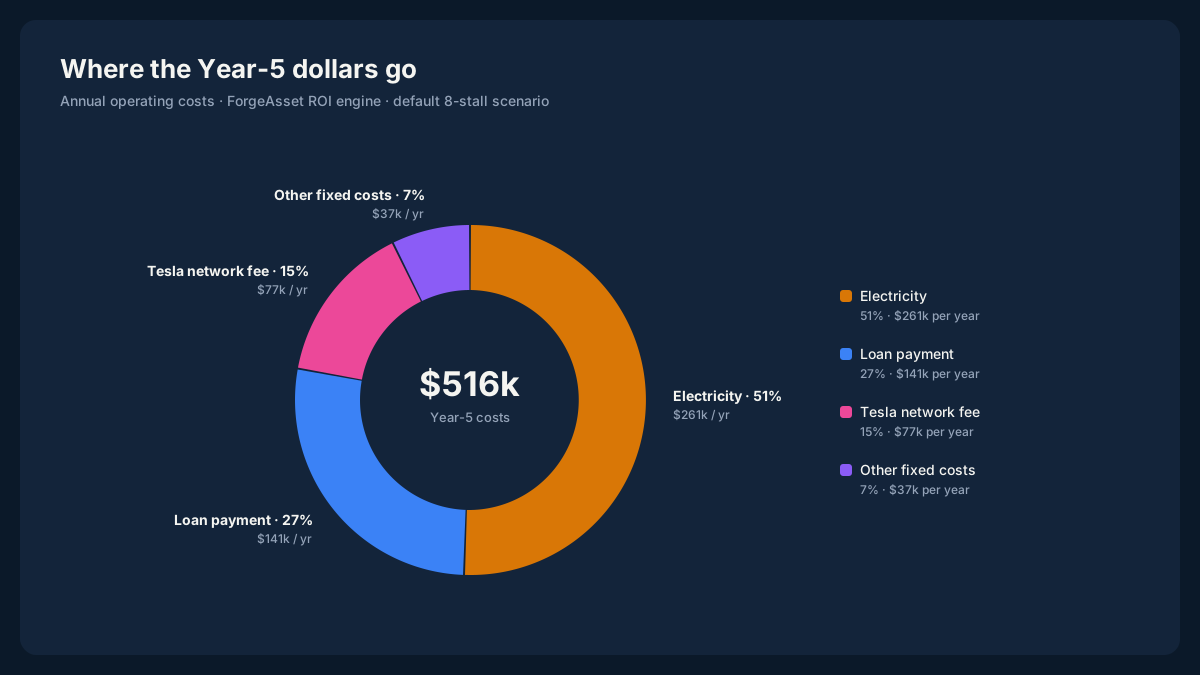
Electricity is roughly half the annual spend. The loan payment and the Tesla network fee together are another four-tenths; rent, insurance, taxes, and accounting fit in the remainder.
Half the operating cost sitting in one line means the structure of that line matters as much as its headline rate. The full cost stack — CAPEX, the fixed monthly lines, and the offsets — is broken down in What it costs to host a Tesla Supercharger.
What moves the electricity line#
Ranked roughly by how much they move the modeled result:
- The demand charge and how it is measured. The per-kW rate, plus whether it bills on the current month's peak, a trailing twelve-month maximum, or a ratchet that holds a past peak in place.
- Time-of-use windows. When the peak lands relative to the utility's on-peak hours, and how far apart the on- and off-peak energy rates sit.
- Riders and fuel adjustments. Separately filed add-ons that reset on their own schedules — quarterly in some jurisdictions — and can move the effective rate by double-digit percentages between filings.
- State and local taxes. Applied to the equipment purchase, the install labor, and in some states the charging revenue itself.
- Clean-fuel credits. LCFS and equivalent programs, where they exist, offset part of the dispensed-kWh cost — covered in EV rates without demand charges, and clean-fuel credits.
What a blended rate hides#
Most quick estimates collapse all of the above into a single blended cents-per-kWh figure. That is a reasonable simplification for a load whose peak tracks its average. For a charging site it hides the specific mechanism that decides the outcome: a blended rate cannot express that one busy interval sets a fixed monthly charge, so it cannot show why the same station diverges so sharply across a utility border.
The ForgeAsset engine reads filed tariffs directly — 49 states and DC, 85 rate rows — carrying demand charges, time-of-use windows, riders, taxes, and credits per site, and outputs a 15-year monthly cash flow, a year-by-year cost breakdown, and an NPV for a specific address on a specific rate. Every rate is digit-checked against the utility's filed sheets; where a rate carries a pilot cap or a scheduled sunset, the report states it rather than folding it into an average.
The filed demand-charge and time-of-use structure for every covered tariff is browsable in the demand-charge lookup, and the jurisdictions are ranked by charging economics in the utility rankings. Which of the five numbers this all resolves into — payback, NPV, IRR, cash-on-cash, upfront capital — is covered in Is hosting a Tesla Supercharger profitable?.
Model a real site
See these numbers for a specific site
The scenario wizard runs the same engine described on this blog: enter an address, stall count, price, and your assumptions, and it computes the payback, NPV, IRR, breakeven utilization, and the full 15-year cash flow for that combination.
Written by
ForgeAsset
Independent underwriting for Tesla's Supercharger for Business program. The figures on this blog come from the same filed tariffs and engine that the scenario wizard runs.
@Forge_Asset on X